Habitat Homeowners' Thoughts related to Neighborhood and Community
Many of the Habitat Homeowners have become more involved in the community and community- related activities since becoming a part of Habitat.
Habitat study participants have gotten to know their neighbors whereas before when they lived in an apartment complex they did not make the effort to do so. Participants have become more vocal about the things they want to see and do within their neighborhoods.
Yes, yes, me and the kids go to church. They throw community block parties a lot and I take the kids to those. We go to the library and do a lot of things at the library. They love the community library down the street.”
Yeah, I know more of my neighbors here. I know the next-door neighbors and the neighbors across the street, but in my apartment, I didn’t know any of my neighbors really, except for the people who had kids. I didn’t even know my next-door neighbors at my apartment.”
Habitat study respondents indicated, the following related to their perspectives on neighborhood and community Post-Habitat:
- Increased involvement in neighborhood activities, community leadership roles, and community connectedness.
- Improved feelings of safety, including reduction in crime rate and drug use/dealing.
- Improvements in race relations and/or racial harmony.
FIGURE 9. Q. Perceptions of Neighborhood and Community Pre- and Post-Habitat Participation.
Source: Sagamore Institute. Habitat for Humanity of Greater Indianapolis Survey Data Analysis SPSS Report (28 July 2017).
Benefits to Quality of Place, Property Sales, and Assessed Values
The Greater Indy Habitat for Humanity housing interventions generated positive spillovers (e.g., removal of blight, improvements to physical structure, creating critical mass of investment) to the surrounding community and its overall quality of place by:

|
Removing disamenities: The Greater Indy Habitat for Humanity emphasizes constructing affordable housing in a way that removes disamenities within a neighborhood (i.e., a “removal effect” (Ellen, 2006 (as cited in Rephann 2014)). The affiliate accomplishes this by maximizing the expected positive neighborhood benefits and minimizing the negative effects by dismantling substandard housing or rehabilitating abandoned or poorly maintained lots.
|

|
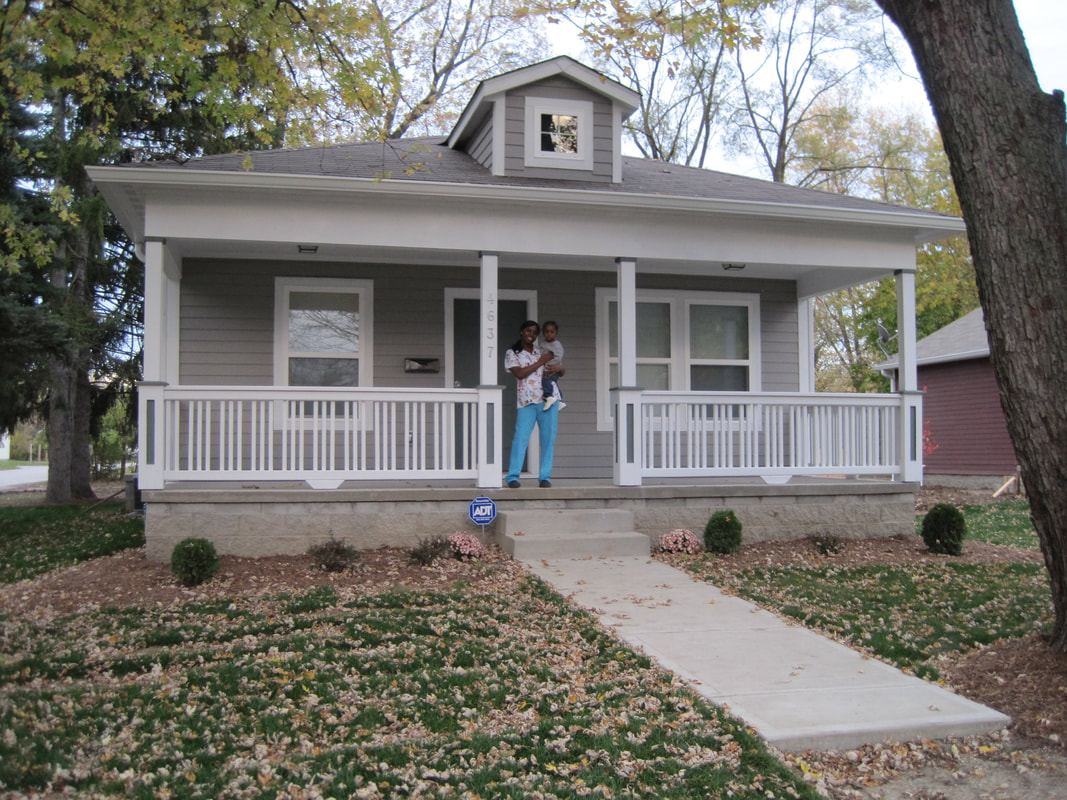
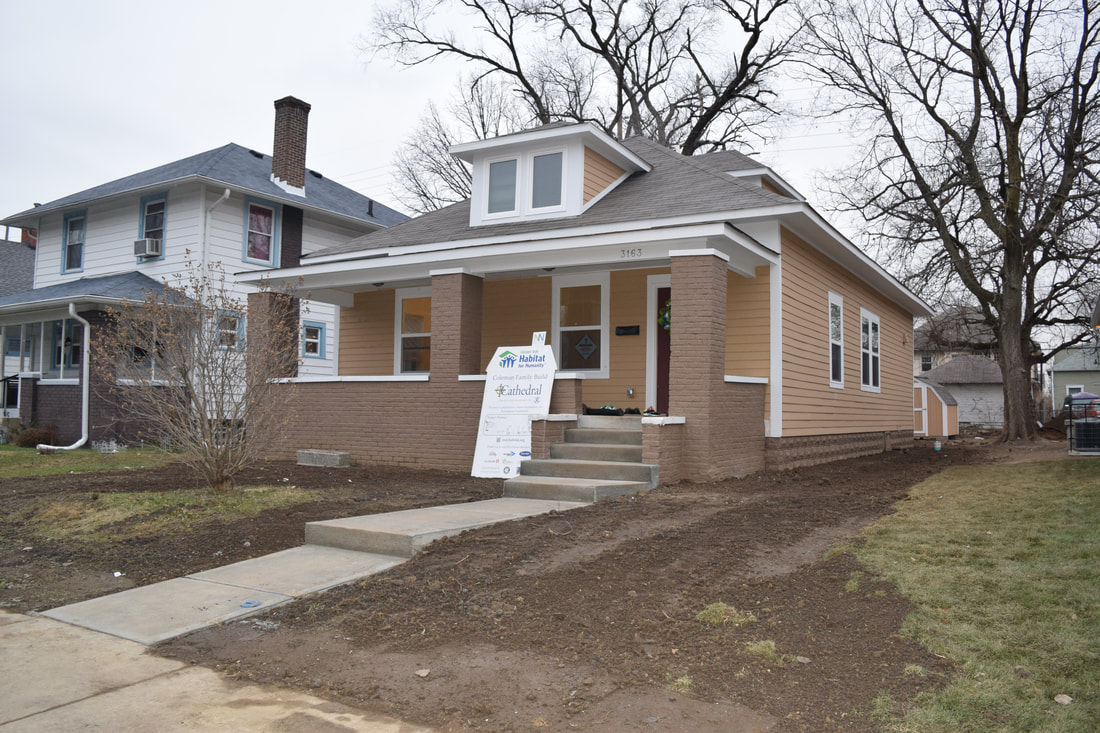
Contributing towards a critical mass of investment: The Greater Indy Habitat for Humanity development efforts lead to physical structure and neighborhood design effects. For example, the Greater Indy Habitat affiliate constructs new housing and renovates existing structures that result in a new amenity. In addition, the affiliate strives to design homes to conform to the style of the surrounding neighborhood.
|
FIGURE 10. Vernon (Before and After).
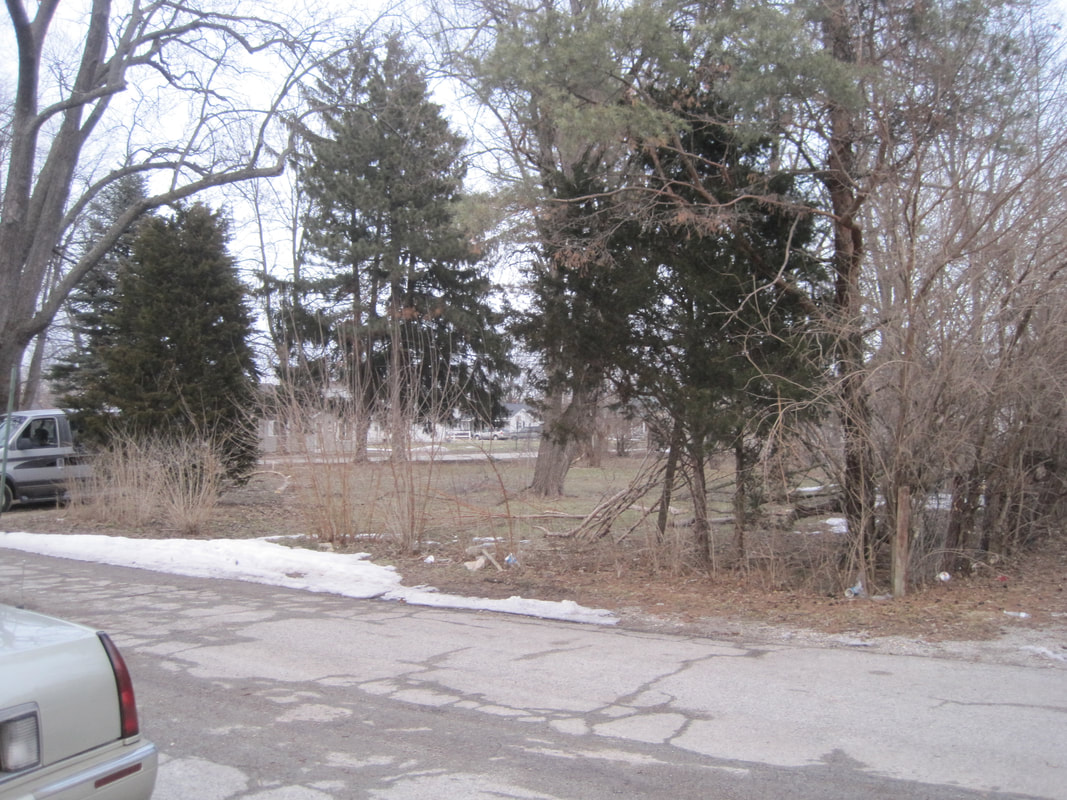
Photos courtesy of Greater Indy Habitat for Humanity (2017).
FIGURE 11. Graceland (Before and After).
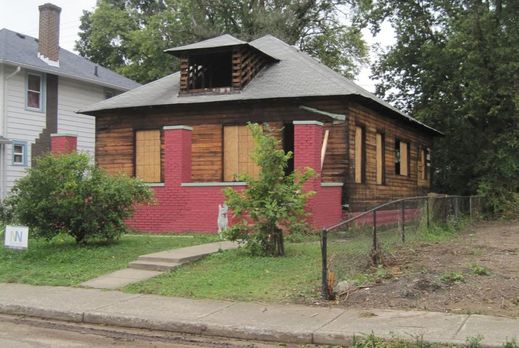
Photos courtesy of Greater Indy Habitat for Humanity (2017).
|
|

|
Creating an environment for private investment: By implementing a clustering strategy, the Greater Indy Habitat for Humanity contributes towards growing a critical mass of investment that results in neighborhood revitalization and highly visible transformations to the landscape (scale effect).
|

|
Improving population and income mix: Mixed income development establishes a population mix effect. The effect produces a neighborhood area with a diverse mix of tenants and homeowner socioeconomic levels that reduces the “threat of income segregation and social stigma” (Ellen, 2006 (as cited in Rephann, 2014)). The Habitat Homeowners are assets in the neighborhoods, in that their average household incomes add to the income combination mix.
|
FIGURE 12. Greater Indy Habitat for Humanity Service Areas: Median Household Income Trends 2000 to 2017, and Projected 2022.
Source: Sagamore Institute. Estimates based on data provided by the Greater Indy Habitat for Humanity, the ESRI Community Analyst, and the National Historic Geographic Information Systems datasets (2017).
The Greater Indy Habitat provides suitable infrastructure to accommodate a denser urban development pattern (i.e., infrastructure effect). For example, in the census tracts where Greater Indy Habitat affiliate constructed homes the populations had an average annual growth of 4.7% between 2010 and 2017, and a projected annual growth rate of 3.3% (Table 24). Thus, it can be implied the redeveloped areas are likely to contribute to population increase in those census tracts. This is referred to as a “population effect” (Ellen, 2006 (as cited in Rephann, 2014)).
FIGURE 13. Greater Indy Habitat for Humanity Service Areas: Populations Trends 2000 to 2017, and Projected 2022.
Source: Sagamore Institute. Estimates based on data provided by the ESRI Community Analyst and the National Historic Geographic Information Systems datasets (2017).

|
Increasing homeownership opportunities: The Greater Indy Habitat for Humanityhomeownership program increases homeownership opportunities through its education and no-interest loan opportunities. In doing so, the process provides new or rehabbed housing options.
|

|
Improving property sales and quality of place for surrounding property owners and the neighborhood overall: According to researchers (Rohe and Stewart, 1996), owner-occupied housing provides positive effects on neighborhood property values and stability due to lower residential turnover and residents who are more vested in maintaining the quality of their properties and neighborhoods. To examine this phenomenon, Sagamore Institute researchers conducted a hedonic difference-in-difference property analysis of single-family home sales occurring between 2009 to 2017 Q2 in areas where the Greater Indy Habitat affiliate constructed or rehabbed a home to assess Habitat’s impact on neighboring properties. The results indicate one outcome of the Greater Indy Habitat homeownership component results in improved properties sales and quality of place for surrounding property owners and neighborhood overall.
In interpreting the results of the difference-in-differences model we were particularly interested in the sign and significance of the coefficients within and after Greater Indy Habitat for Humanity intervention. A significant coefficient would indicate that the influence of the time change from pre-intervention (2009 to 2012) and post-intervention (2014 to 2017 Q2) on residential property values near a Habitat intervention completed in 2013. The expectation that properties near a Habitat intervention will exhibit a significant change in property values from pre-intervention to post-intervention. In this analysis, proximity to Habitat properties– the construction and occupancy of Habitat homes—is the key local feature that we seek to assign a value. If Habitat properties create a local dis-amenity effect, we expected the coefficient corresponding to the Habitat proximity variable to be negative. If it creates a local amenity, we expected the coefficient to be positive. Thus, a significant and positive within and after coefficient would indicate that the affiliate’s efforts does indeed raise nearby residential property sales values. Indicators of a Sale Occurring Within a Target Area and After Habitat for Humanity of Greater Indy Intervention (2014 and later) illustrate that for average homes sold within and post-intervention sales value increased at a higher percentage (+80.0%) than those sold outside the target area and after intervention (+66.9%). |
FIGURE 15. Greater Indy Habitat for Humanity Service Areas: Regression Results of Home Sales Pre-Intervention (2009 to 2012) and Post-Intervention (2014 to 2017 Q2) (4, 442 observations)
Statistical Significance Key: *** = Less than 0.001; ** = Less than 0.01; * = Less than 0.05
Source: Sagamore Institute. Estimates based on data provided by the ESRI Community Analyst and the National Historic Geographic Information Systems datasets (2017).

|
Increasing the assessed value of each property: The Greater Indy Habitat for Humanity intervention with a property considerably increased the assessed value of each property. For example,
Before (Pre-) Habitat Intervention: The average assessed value prior to Greater Indy Habitat intervention was valued at $3,405. After (Post-) Habitat Intervention: After a Greater Indy Habitat intervention, on average the properties are valued at $67,471. Therefore, the direct impact of Greater Indy Habitat for Humanity investment is a $64,067 increase in each property’s assessed value. This is an average increase of 18.8 times beyond the assessed values Pre-Habitat intervention. |
FIGURE 15. Greater Indy Habitat for Humanity Effects on Assessed Property Values Pre-Intervention (2009 to 2012) and Post-Intervention (2014 – 2017 Q2).
Source: Sagamore Institute. Estimates calculated using data provided by the Greater Indy Habitat for Humanity Habitat Homeowner Locations (25 May 2017) and the Indiana Department of Local Government Finance (2017).

|
Providing financial benefits to Habitat Homeowners: The Greater Indy Habitat for Humanity model of affordable housing provides great monetary value to families and neighborhood and reduced the possibility of foreclosure, thereby helping to maintain neighborhood stability.
Aggregate Assessed Property Value: The findings show that the subsidized mortgages result in a benefit, provided by Greater Indy Habitat to its Homeowners, of $43.3 million in aggregated assessed property value over the past two decades ; on average over that same period, the no-interest loans represent a benefit of $113,174 per property. Aggregate Value of No-Interest Loans: The findings show that the subsidized mortgages result in a benefit, provided by Greater Indy Habitat to its Homeowners, of $42.5 million in aggregated average value of no-interest loans over the past two decades; on average over that time, the no-interest loans represent a benefit of $111,205 per family placed. Value of Homeownership Education: In addition, Habitat’s Homeownership Education Program has a direct impact of $2,204 to $5,800 per household in reduced likelihood of foreclosure. |
FIGURE 16. Aggregate Value of Habitat for Greater Indy Humanity No-interest Loans

|
Improving fiscal benefits for local governments. The direct benefit to local administrations of costs associated with blighted and vacant property resulting from Greater Indy Habitats’ Homeownership interventions is nearly $9.3 million, the housing new build/rehab represent a benefit of $24,174 per family placed.
|
FIGURE 17. Estimated Greater Indy Habitat for Humanity Homeownership Intervention Benefits to Local Governments
Source: Estimate derived from calculated costs as defined by Apgar, W. C., & Duda, M. (2005). Collateral damage: The municipal impact of today's mortgage foreclosure boom. Homeownership Preservation Foundation.
Estimated Increase Property Tax Base: To develop a per-unit value of the fiscal benefit of a Greater Indy Habitat for Humanity intervention, Sagamore Institute calculated the aggregate value of increased property tax base realized over ten years (slightly less than the average tenure of a homeowner, but timeframe of which the states 1 percent tax cap went into effect). Local government receives an average of $11, 456 in fiscal benefit reflected in increased tax base due to each property intervention implemented by the Greater Indianapolis Habitat affiliate (i.e., new builds and/or rehabs/recycled).
Estimated Reduction in Court Ordered Sales/Foreclosures: The volume of court order single-family home sales occurring within the Greater Indy Habitat for Humanity target areas declined on average by 6.8% across all counties and zip codes. In addition, outcomes from the application of an Interrupted Time Series analysis confirm with statistical significance a decrease of an estimated 79 documented court order/foreclosure sales per year (the direct intervention effect) Post-Habitat intervention.
Estimated Reduction in Court Ordered Sales/Foreclosures: The volume of court order single-family home sales occurring within the Greater Indy Habitat for Humanity target areas declined on average by 6.8% across all counties and zip codes. In addition, outcomes from the application of an Interrupted Time Series analysis confirm with statistical significance a decrease of an estimated 79 documented court order/foreclosure sales per year (the direct intervention effect) Post-Habitat intervention.
FIGURE 18. Trends in Court Ordered Sales for Properties Sold Within the Greater Indy Habitat Target Area 2009 to 2017 Q2.
Source: Estimated based on data provided by the Indiana Department of Local Government Finance and Stats Indiana (2009 - 2017).
